GLM-5.3-Flash Ran Out of Cache Snapshots, Not Cache Tokens
Sep 26, 2026
Our GLM-5.3-Flash replicas kept forgetting cached prompts while their 500,000-token KV cache sat mostly empty. On a hybrid linear-attention model the limit was 28 state snapshots. Here is how we found it and what fixed it.
The Helix agents we run on GLM-5.3-Flash usually start answering in about a second. Every so often one of them would wait eight or ten seconds instead, and once a reply stalled for 68 seconds. The engine reported that it had reused none of the prompt, not even the 17,000-token system prompt and tool list that every call of that agent sends first.
That looked like a cache that was too small. It wasn't. On one replica, a prompt reused 49,152 cached tokens at 12:31:59. A 313,000-token prompt from a different agent arrived at 12:33. At 12:35:04 the first prompt came back and reused nothing, even though both prompts together filled only 72% of the replica's 500,000-token cache.
GLM-5.3-Flash is a hybrid model. Most of its layers do not keep a key-value cache at all, and the thing those layers need to reuse a prompt is much scarcer than cache tokens.
Attention layers keep every token, KDA layers keep a summary
A standard attention layer stores a key and a value for every token it has read. That KV cache is what makes prompt reuse cheap. If two requests start with the same 20,000 tokens, the second one picks up the stored keys and values and only processes what is new. It can do this at any token boundary, because each token's entry stands on its own.
GLM-5.3-Flash has 45 language layers, and only 11 of them work that way. The other 34 are KDA linear-attention layers. Instead of a growing list of keys and values, each keeps one fixed-size state that is updated as every token goes by. That state is a running summary of everything read so far, and it cannot be recomputed from the KV cache. To resume a prompt at token 12,288, the engine needs the KV for tokens 1 to 12,288 and a copy of the KDA state exactly as it stood after token 12,288.
So a cache hit on this model needs two things: the attention KV, and a saved snapshot of the recurrent state at the point where the new request diverges.
The engine only saves snapshots at a few places
SGLang, the engine we use for GLM, reads long prompts in chunks, 6,144 tokens each in our configuration. It saves a KDA snapshot at the end of each chunk and one near the end of each request, rounded down to a multiple of 256 tokens. Between those points there is nothing to resume from.
We measured what that means by sending a 19,845-token synthetic prompt to one of our production replicas and then sending variations of it.
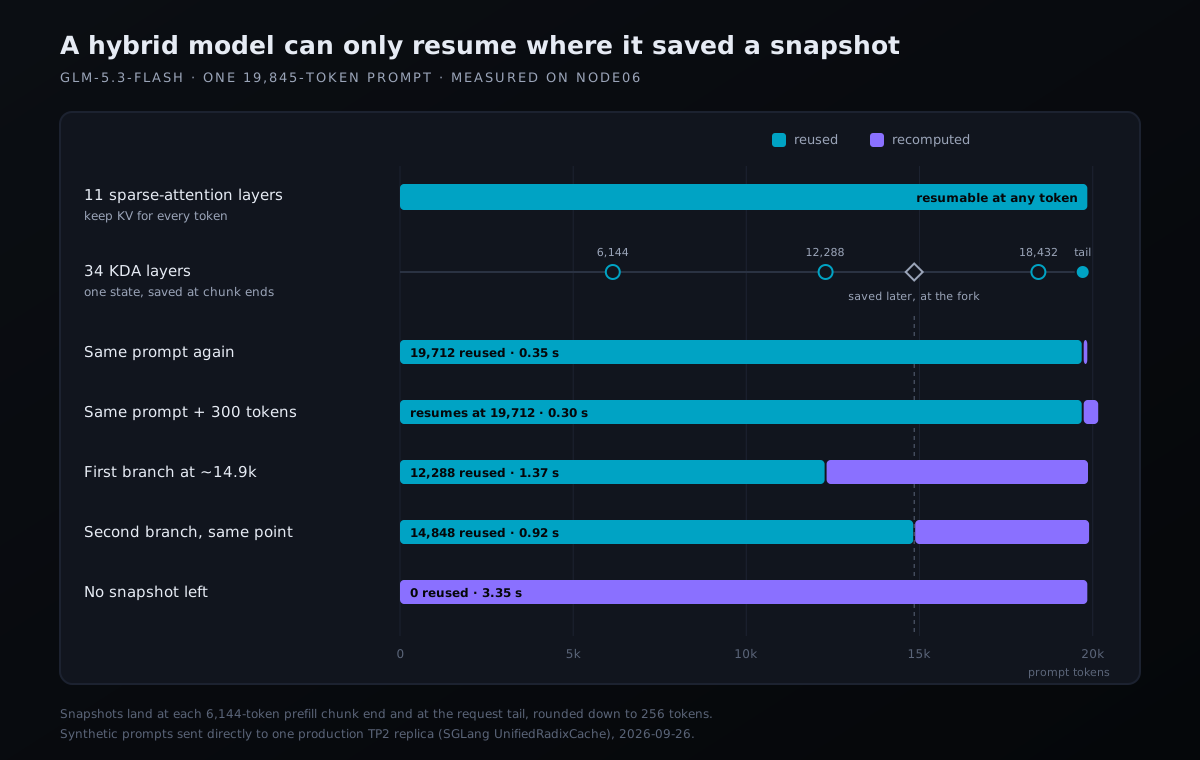
Measured on one production TP2 replica with synthetic prompts. Cached-token counts come from the engine's own usage report.
Re-sending the same prompt reused 19,712 of 19,845 tokens, the snapshot at its tail. Appending 300 tokens to it resumed from the same place. Agent loops look like this: each call is the previous one plus new messages at the end.
A request that shared the first 14,900 tokens and then went its own way reused only 12,288. The attention layers had KV for all 14,900 shared tokens, but the nearest KDA snapshot was at 12,288, so the engine recomputed from there. When a second request branched at the same point, it reused 14,848, because by then the engine had saved a snapshot where the first branch split off.
A 500,000-token cache with room for 28 snapshots
Each of our GLM replicas is one model copy spread across two RTX PRO 6000 GPUs. On each GPU, the KV cache holds 499,968 tokens in FP8 and takes about 3.4 GB. The snapshot pool has 28 slots. A slot is about 38 MB per GPU because it holds the state of all 34 KDA layers.
Those slots are shared with the requests that are running. Over nine days of engine logs, each running request held about four of them. With four requests in flight, 12 slots were left for cached prompts.
A 313,000-token prompt is 51 chunks, so it produces 51 snapshots while it is being read. The pool evicts the least recently used snapshot whenever it needs a free slot. By the end of that one prompt, every other conversation's snapshots were gone. Their KV was still sitting in the half-empty token cache, but without a snapshot none of it could be used.
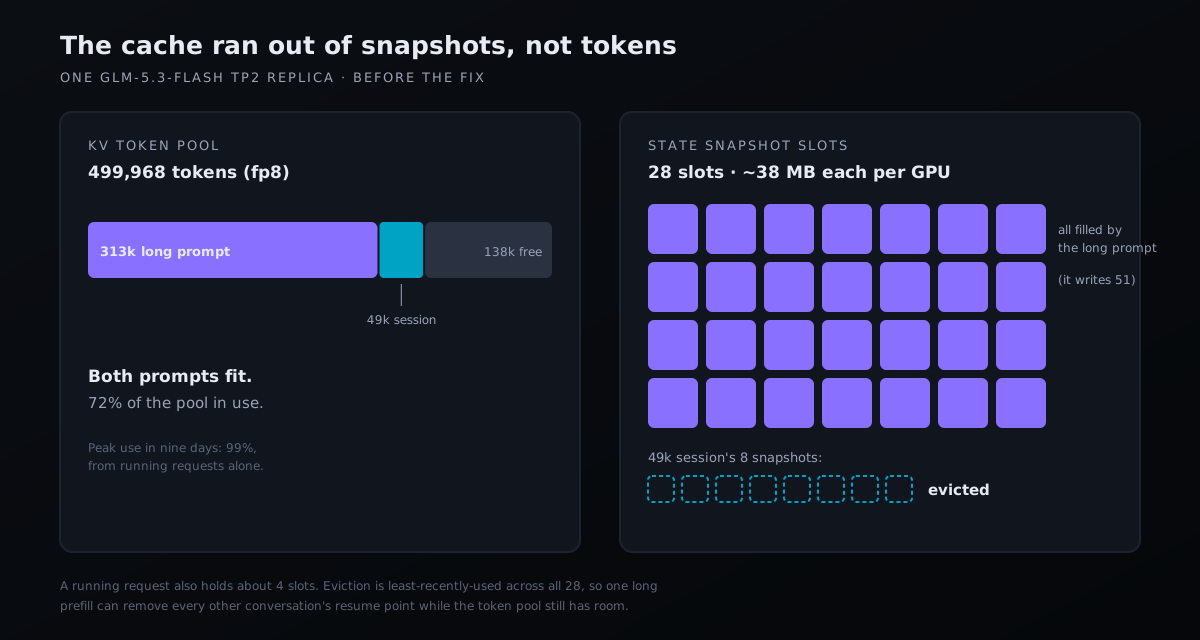
One replica before the fix. The token pool had room for both prompts. The snapshot pool did not.
To reproduce it on demand, we sent one replica six 20,000-token sessions, then one 308,000-token prompt, then the six sessions again. With the stock settings, all six came back cold and took 3.35 seconds each.
What a cold turn costs a long conversation
An agent re-sends its whole conversation on every turn, so the cost of a miss grows with the conversation. The chart below is one real session from 24 and 25 September, before the fix: 322 turns over fifteen hours, with the prompt growing to 318,000 tokens.
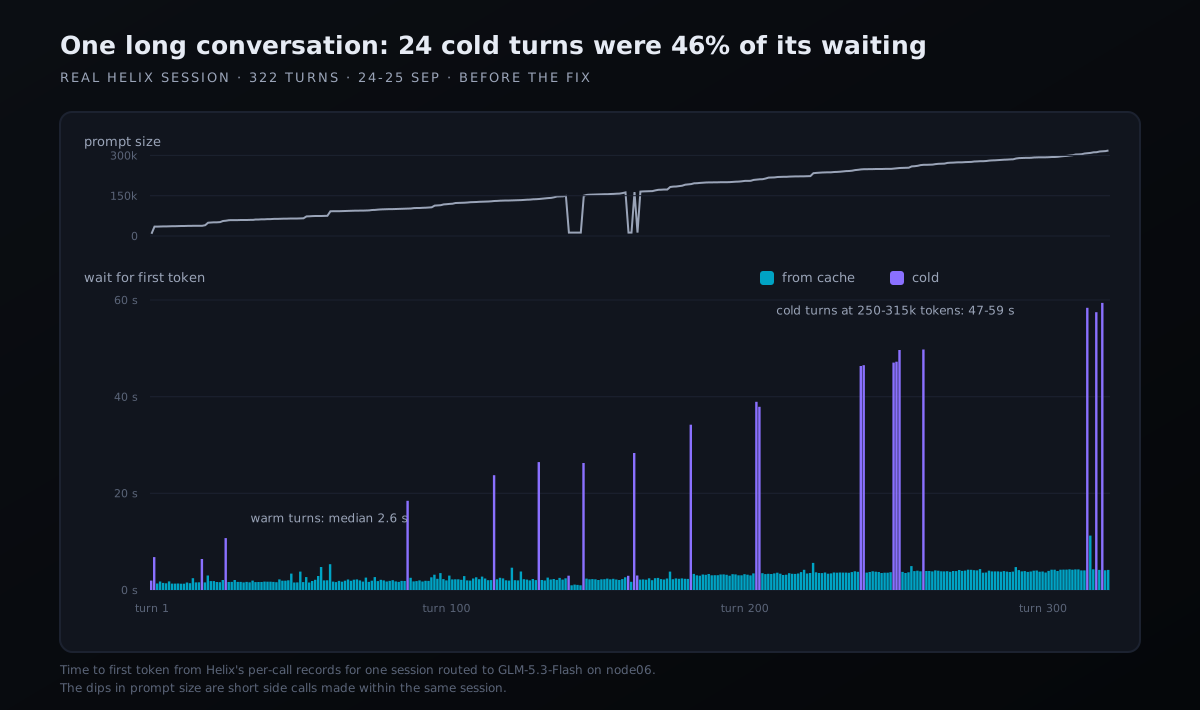
One session's per-call records from Helix, before the fix.
When the cache held, a turn started in a median of 2.6 seconds, even at 300,000 tokens. When it didn't, the engine re-read everything: about 18 seconds at 100,000 tokens and close to a minute past 250,000. Only 24 of the 322 turns went cold, but they account for 731 of the conversation's 1,575 seconds of waiting. Several of the worst ones came minutes apart around 06:15, while another conversation of more than 200,000 tokens was active.
Keeping two snapshots per conversation
SGLang can cap how many snapshots it keeps along each conversation's path (--mamba-max-states-per-path). When a path goes over the cap, it drops the oldest snapshots and keeps the newest ones, plus any snapshot at a point where two conversations fork.
We restarted that replica with a cap of four, cut off from the load balancer so that only our test traffic reached it, and repeated the probe. All six sessions stayed cached through the long prompt. Each came back in 0.15 to 0.30 seconds with 99.6% of its prompt reused.
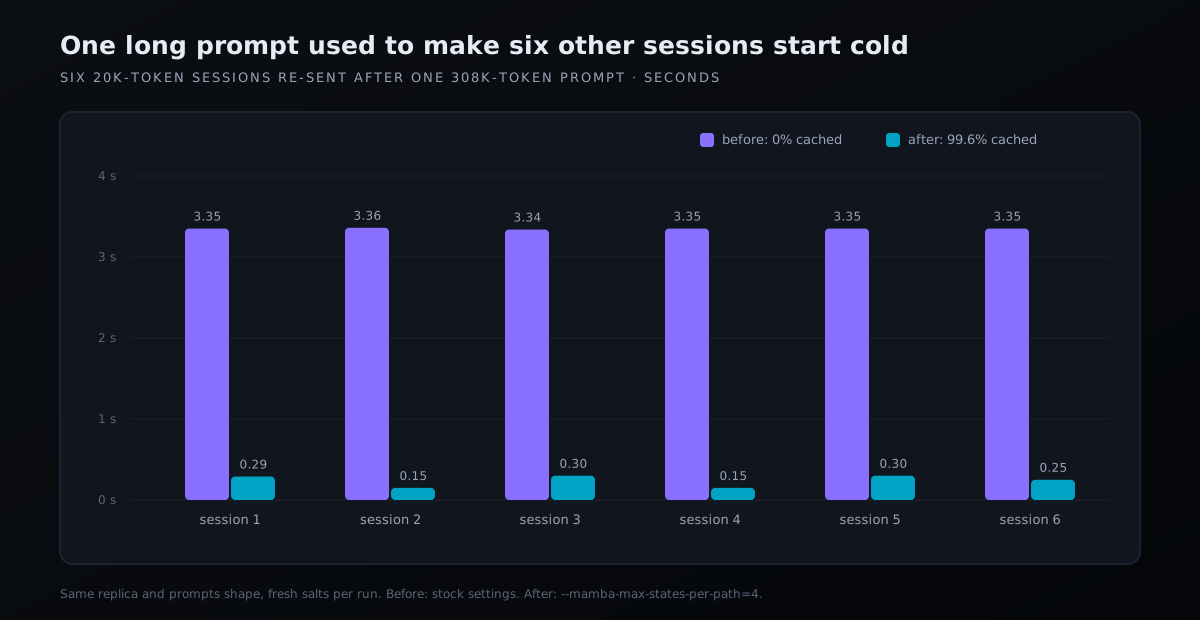
Same replica, same prompt sizes, fresh prompts for each run.
The cap also decides how many conversations fit at all. A 20,000-token session produces four snapshots (three chunk ends and its tail). With about 24 slots free and four snapshots each, a replica held six such sessions. Re-sending twelve sessions in a loop missed every time, because each request evicted the snapshots the next one needed. A cap of two halves the cost of each conversation, and the same twelve sessions all stayed cached.
The cost is in the branching case from the first chart. A request that leaves an old conversation partway through resumes from the nearest snapshot before the split, and keeping fewer snapshots on each path leaves fewer of them to choose from. Our agents almost always extend the conversation from its end, so we accepted that and set the cap to two.
A host-memory tier for what still gets evicted
When more conversations are active than the GPUs can hold, SGLang's hierarchical cache can keep copies in ordinary server memory. We gave it 4 GB per GPU. That holds 308,288 tokens of KV and 1.57 GB of snapshots for each GPU, and it pins about 8 GB of the server's RAM per replica.
With fourteen 20,000-token sessions, two more than fit on the GPUs, 11 came back from host memory in 0.40 to 0.45 seconds instead of being recomputed in 3.4 seconds. At sixteen sessions the host tier was full as well, and only 5 of 16 hit.
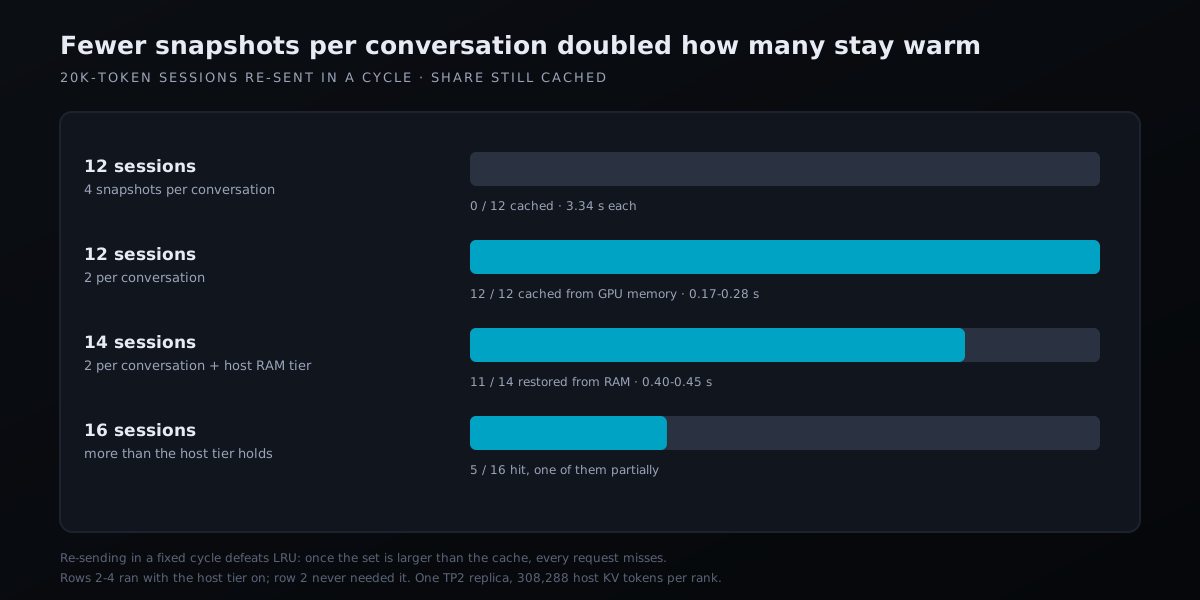
Re-sending sessions in a fixed loop is the worst case for least-recently-used eviction. Real traffic is kinder, but the capacity limits are the same.
The host tier is the more expensive of the two changes. The server's RAM is also needed by the Qwen engine that shares the machine, and the gain over the cap alone is two or three extra conversations per replica. We kept it because each hit it produces saves about three seconds of recomputation on a 20,000-token prompt, and more on longer ones.
Keeping long prompts on one replica made them slower
We run two GLM replicas, and Ramjet, our load balancer, normally sends each conversation back to the replica that already holds its prompt. As a third change we added a rule to it: any request larger than 600,000 bytes, roughly 150,000 tokens of ordinary text, goes only to the second replica. The idea was to keep 57-second prompt reads, and whatever they evict, away from the first replica.
That works while only one long conversation is active. In our Helix records, two conversations of more than 150,000 tokens were active at the same time in 82 of 522 active minutes. So we replayed that case through the live load balancer: two synthetic conversations of about 290,000 tokens, growing by 4,000 tokens a turn, alternating with six ordinary 20,000-token agent sessions.
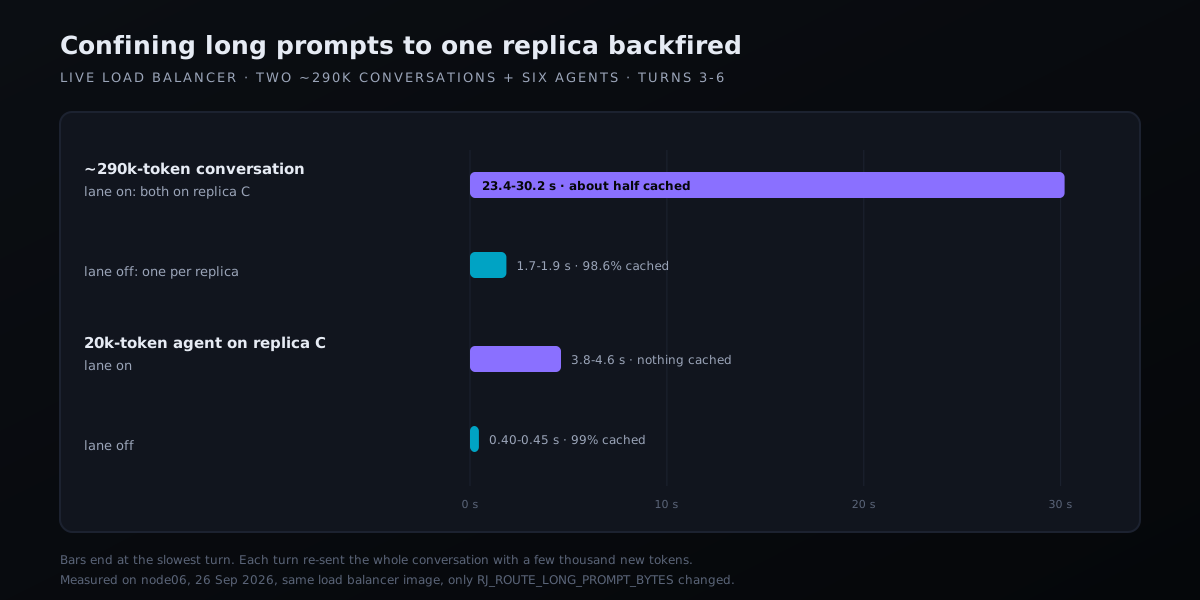
Same load balancer image and traffic. Only the long-prompt threshold changed.
Two conversations of 290,000 tokens need about 580,000 tokens of KV, and one replica holds 500,000. With both confined to the same replica, they kept evicting each other and re-read about half their prompt on every turn. They also pushed every other session on that replica out of the cache. For long conversations the token pool is the limit, and the answer is to use both replicas' pools.
With the rule off, the load balancer placed one conversation on each replica, and every turn after the first was 98.6% cached. We turned the rule off on 26 September. It remains in Ramjet as an option.
What did not help
More KV cache. The token pool was 72% full when the eviction happened, and running requests alone had reached 99% of it at their busiest. Moving memory from the token pool to snapshot slots would have traded one bottleneck for another. A more compressed checkpoint would have left more memory free, but the snapshot pool size is set separately, and the token pool was not the problem.
Smaller snapshots. Our SGLang build can store cached snapshots at 8-bit precision, roughly doubling how many fit. The option only works with the older of SGLang's two cache implementations, not the one GLM uses, and it cannot be combined with the host-memory tier.
A single four-GPU copy of the model. Halving the weights per GPU would free a lot of memory. But the upstream recipe we use is qualified only on two-GPU copies, and it would leave us one replica instead of two.
The result in production
The two GLM replicas have run with the snapshot cap and the host tier since 25 September at 15:13 UTC. Ramjet records, for every request it routes, the prompt size, how much of it was cached and the wait for the first token, whichever client sent it.
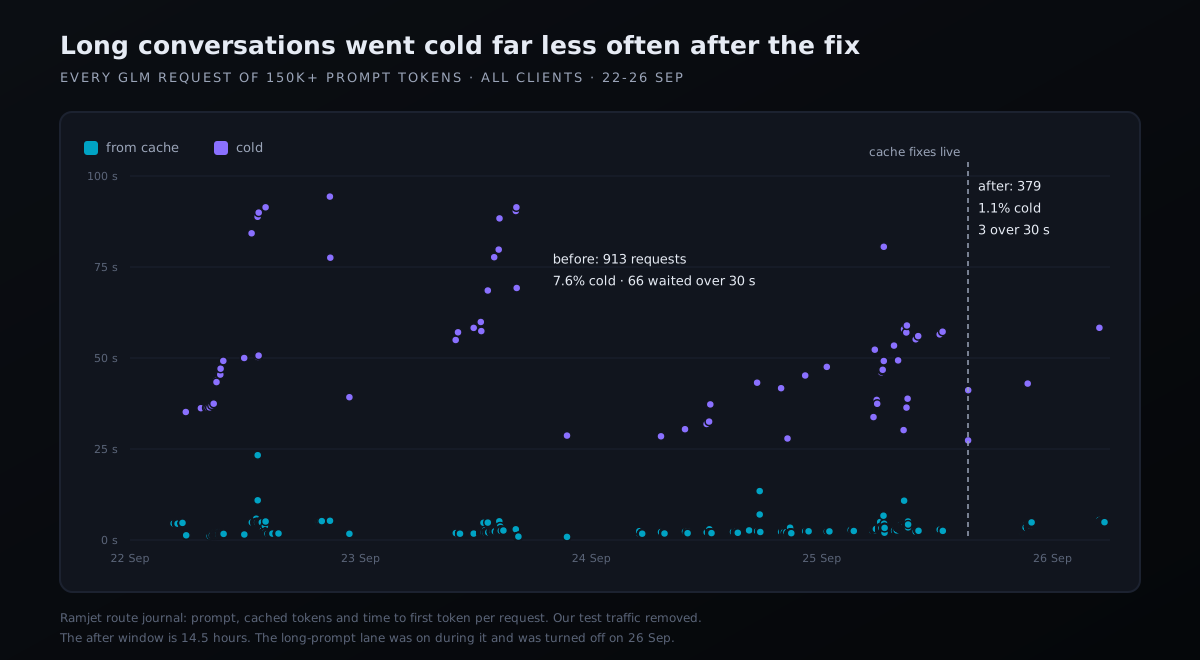
All clients of our GLM replicas, with our own test traffic removed.
For conversations of 150,000 tokens or more, the share of cold turns fell from 7.6% to 1.1%, and waits over 30 seconds fell from 66 in 913 requests to 3 in 379. For ordinary 8,000 to 150,000-token requests, cold turns fell from 5.4% to 3.1%, and waits over 10 seconds from 70 in 12,518 to 1 in 514. The after window is only 14.5 hours of quieter overnight traffic, and the long-prompt rule was still on during it, so these numbers are a direction, not a final result.
We also re-ran the eleven-case test suite for one of our Helix agents before and after the rollout. With warm caches, the share of each session's first large call served from cache went from 90.5% to 98.9%. The median wait for the first token fell from 1.18 to 1.10 seconds.
That comparison is loose. The "before" run used one replica whose cache had been warm for eight days, and the agent's prompt changed between the runs. The suite also sends its sessions seconds apart, so it never reproduces the long-prompt evictions that started this. The controlled probes above are the measurement of the fix.
If you serve a hybrid model
The engine flags differ between SGLang and vLLM, but the same questions apply to any model that mixes attention with linear-attention or state-space layers:
- How many state snapshot slots does the engine allocate, and how many does each running request hold? SGLang logs both (
Mamba Cache is allocated. max_mamba_cache_sizeat startup,mamba numin the decode log). - Where does it save snapshots? Cached-token counts that land on exact multiples of the prefill chunk size are a sign that reuse is stopping at snapshots.
- Can one long prompt write more snapshots than the pool holds? If so, cap the snapshots per conversation.
- Do your long conversations fit together? A replica's token pool holds a fixed number of tokens. Two long conversations that don't fit on one replica should be spread across replicas, not confined to one.
- Is the cache report counting KV tokens or usable prefixes? Here the token pool looked healthy the whole time.
The measurements, rejected settings and deployment files are in the public Ramjet experiment journal and the GLM TP2 recipe. The long-prompt rule is in Ramjet v0.6.2 and is off by default.
This is the third post on running GLM-5.3-Flash on our own hardware, after getting it to serve at all and running it on two, four or eight GPUs. The Helix Sovereign Server it runs on has eight RTX PRO 6000 Blackwell Server Edition GPUs. Talk to Helix about a deployment.